


Section 1.2: Straight lines
(Terminology: All lines are “straight” lines. Every line
is a curve. Not every curve is a line.
A line is a curve that is not curved.)
We will review some familiar facts about lines very quickly with very few
examples:
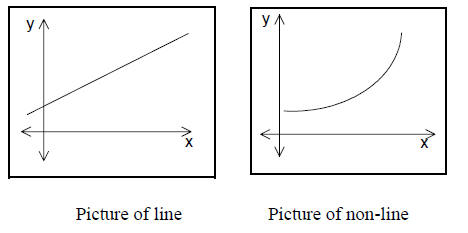
The line has constant “steepness”, not the other curve.
The line rises at a constant rate, not the
other curve.
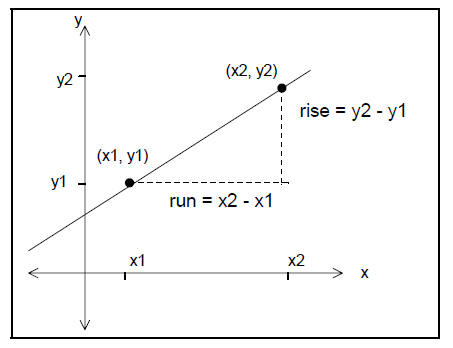
Picture of line, with two distinguished points
Our measure of steepness: slope,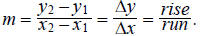
(Question: Why do we refer to slope with the letter, “m”; why not, say, “s”?)
Note that it does not matter to which of the two points we
affix the subscripts, “1” and “2”.
In fact, it does not matter which two points on the line we choose in order to
compute the slope.
Our measure of steepness is a signed measure.
 |
 |
 |
 |
| Line is rising | Line is falling | Horizontal line | Vertical line |
| m>0 | m>0 | m=0 | m: undefined |
| (Don’t say: “No slope”). | |||
Convince yourself for each of the above pictures, that the
claimed sign of the slope is correct.
In each case, pick any two points along the line, one with x1 and one
with x2; choose one as the
starting point, one as the final point. Note the sign of the run,
 note the sign of the rise,

What is the sign of the resulting ratio,
What does the sign of the slope tell us about the
relationship between x and y?
If the slope is positive, we say that x and y have a “positive” relationship. In
this case, x and y
move in the same direction: if x increases, so does y; if x decreases, so does
y.
If the slope is negative, we say that x and y have a “negative” relationship. In
this case, x and y
move in opposite directions: if x increases, then y decreases; if x decreases,
then y increases.
The steeper the line, the greater the magnitude of the slope.
Equation of a line: The equation of a line
represents a condition which is satisfied by every
point on that line and only by the points on that line.
Different forms for the equation of a line (This is not an exhaustive list.):
1. Equation of a horizontal line: A horizontal line
consists of all of the points with the same
y-coordinate, b. Therefore the equation of a horizontal line can be written y =
b.
2. Equation of a vertical line: A vertical line
consists of all of the points with the same
x-coordinate, a. Therefore the equation of a vertical line can be written x = a.
3. Point-slope form: A line with slope m which
passes through the point (x0, y0 ) satisfies the
equation y − y0 = m(x − x0 ). (Notice that this is just a
restatement of the definition of slope:
namely, rise = slope & run.).
4. Slope-intercept form: A line with slope m and
y-intercept b satisfies the equation y = mx + b.
(Remember, the y-intercept of a line is the y-coordinate of the point where the
line intersects the
y-axis, i.e., the y-coordinate of the point on the line with x-coordinate 0. The
x-intercept is
defined similarly.)
Question:
True or false? Every line has exactly one y-intercept.
If this statement is false, describe the exceptional lines and the number of
y-intercepts they
possess.
Answer: False. There are lines which lack a y-intercept. (Which lines are they?)
There is one line
which has infinitely many y-intercepts. (Which line is it?)
Example: Find the equation of the line which passes
through the points (3, 2) and (1, 5).
First, we find the slope of the line: 
The point-slope form of the line is therefore, .
You should not leave your final answer in point-slope form.
Solving for y, we obtain the slope-intercept form:
 (y-intercept = 13/2)
(To check your answer, you should plug in the two specified points which must
lie on the line.
For example, when x = 3,  It checks! Now
check the point, (1, 5).)
It checks! Now
check the point, (1, 5).)
5. General form: The equation of every line can be
expressed in so-called “general form”,
Ax + By = C, where A, B, and C are constants, and A and B cannot both be zero.
Question: Why was this last restriction (“A and B cannot
both be 0”) added? If both A and B are
equal to zero, what is the graph of the resulting equation.
Hint: Consider two cases: 0x + 0y = 0 and 0x + 0y = C, where C ≠ 0
There are infinitely many ways to write the equation of a
given line in general form. After all,
multiplying the equation by any non-zero number does not change the set of
points which satisfy
the equation.
So which numbers should we use as our A, B, C?
Some like to insist that A, B, and C be integers (if possible), with no common
factors.
We may sometimes impose this restriction, but a far more sensible restriction
would be to insist
that (if possible) A, B, and C possess meaningful interpretations.
Example: Refer to the last example. Write the equation of
the line in general form.
Move the x-term to the left by addition to obtain, .
Since there is no context for meaningful interpretation, we may as well pretty
up the equation:
multiply both sides by 2 to obtain 3x + 2y = 13.
Once past Chapter 1, we will work almost exclusively with
the general form. We will refer to
Ax + By = C, as a linear equation in two variables. The obvious extensions are
Ax + By + Cz = D,
a linear equation in three variables,...etc.,...
 , a linear equation
in n variables.
(Question: What is so general about the general form ? Why
isn’t y = mx + b sufficiently
“general”?.
Hint: Try to write the equation of a vertical line in the form y = mx + b.)
The slope-intercept form, y = mx + b, is often used when
we are studying the relationship
between two variables x and y, and it seems natural to us to think of y
“depending” on x.
The general form is often used when we are studying the relationship between two
variables x
and y, and do not see any basis for arbitrarily picking out one of the
variables, say y, and calling it
the “dependent” variable, and isolating this dependent variable on the left hand
side of the
equation. (See the widget example below. Is there any natural choice for
“dependent” variable?))
Example: Let x and y represent the number of Deluxe and
Regular widgets produced per day,
respectively. Each Regular widget requires 2.5 hours of labor; each Deluxe
widget requires 3.2
hours of labor; there are 18 available hours of labor per day. If all of the
available labor is to be
used each day, then x and y must satisfy the relationship 2.5x + 3.2y = 18.
Anticipatory note: The constraint we have imposed on
production of widgets does not seem all
that reasonable. If we have 18 available hours of labor, then we cannot use more
than 18 hours,
but it should certainly be possible to use less than 18 hours. When we get to
“linear
programming” in Chapter 3, we will impose a much more realistic constraint on
the production
of widgets, namely the inequality 2.5x + 3.2y ≤ 18.
To graph a line:
It is clear to all of you that two points determine a line, so that once you
have plotted any two
points on the line, the graph of the line can be constructed by using a
straightedge to draw the
line passing through the two specified points.
Recommended method for sketching (non-vertical, non-horizontal) lines:
Set x = 0, solve for y to obtain the y-intercept. Plot it.
Set y = 0, solve for x to obtain the x-intercept. Plot it.
Sketch the line passing through these two intercepts.
This method has many advantages for us:
1. Since we will be working with equations in general form, it is especially
easy to solve for
the intercepts. To find the y-intercept, just cover up the x-term, and solve for
y. To find the
x-intercept, just cover up the y-term, and solve for x.
2. Since the points are on the axes, not in the interior of the quadrants, they
are easier to plot.
3. As we will see in Chapters 3 and 4, the intercepts often have great
significance.
Example: Sketch the line, 3x + 2y = 13. (The x-intercept is 13/3 ; the y-intercept is 13/2.)
Note: This method will not work on lines which pass
through the origin. If the line passes
through the origin, you will need to plot a 2nd point in addition to the origin.
You could plug any
value of x (or y) into the equation, solve for the other coordinate, then plot
the resulting point.
Example: Sketch the line, 2x - y = 0. (One point is (0,0).
To get a second point, I set x equal to
(say) 1, solve for y. My second point is (1,2).)
Assignment: Work the problems in Section 1.2. These should be familiar. If they
are not
familiar, then you should certainly work these problems.