


Lines and the Cartesian Plane
The Cartesian Plane
At this point, many people have seen several types of graphs. In the newspapers,
one sees pie charts and bar charts. These are both forms of graphs.
Often times in the stock market journals, one sees graphs that show the
performance of stocks over time. These are all ways of attaching a visual
representation to a bunch of numbers.
However, the sort of graph we are interested in here are graphs in the
cartesian plane. The cartesian plane provides a pallate on which to
graph,
and it is built by taking two number lines and making them cross at a right
angle where both of them are zero. Then, we have one number line going up
and down, and another number line going from left to right. By convention,
we make the positive numbers of the up and down number line go up, and
the positive numbers of the left to right number line go to the right. The
result is shown below in Fig 1.
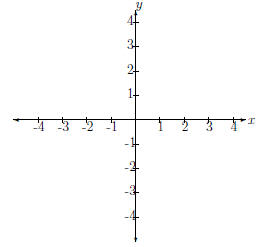
Figure 1: Cartesian Plane
If you take a long hard look at this, it is just two real number lines crossed
as described previously.
Notice that there is an x at the right end of the horizontal number line
and a y at the top of the vertical number line. We call these two number
lines axes. Specifically, we call the horizontal number line the x-axis and the
vertical number line the y-axis. This is another convention mathematicians
use. This gives us a way of identifying each point in the cartesian plane as
an ordered pair (x, y). It is a pair because there are two numbers, and it is
ordered because we put the x value before the y value. For example, we can
find (2, 3) in the cartesian plane by going along the x axis to 2 and along the
y axis to 3. This is shown in Fig. 2.
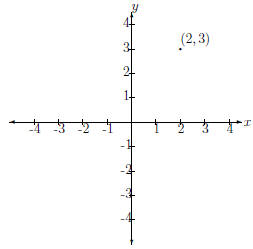
Figure 2: Ordered Pair
Now, we have some more terminology that goes along with the cartesian
plane. Notice that there are four distinct areas of the cartesian plane. We
name them quadrants because there are four of them. Each one has its own
number, which we write as a roman numeral. That is, quadrants I (1), II
(2), III (3) and IV (4). Their locations are indicated in the cartesian plane
in Fig. 3.
Notice that in quadrants I and II, y is always positive. In quadrants I
and IV, x is always positive. This pattern is illustrated in Fig. 4.
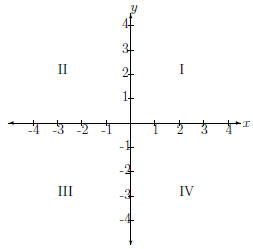
Figure 3: Quadrants of the Cartesian Plane
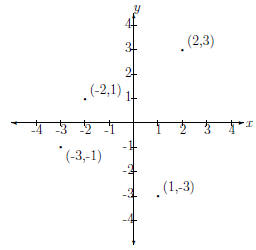
Figure 4: Ordered Pairs in each Quadrant
However, we don't have to pick integers as the x and y
values to plot
in the cartesian plane. In fact, since the plane is constructed with two real
number lines, any real number will work for the x and y values. We will
exploit this in later sections to plot more complicated things. Our next step
is figuring out everything we can about lines.
Lines
Many people have seen lines before, either in plots on the news or in other
mathematics courses. However, if you have not, don't panic. We will go
through all of the steps here.
Let's start by looking at an example to get an idea for what we are going
to deal with. Let's look at y = 2x + 3. How do we start this? What are we
supposed to do? What does this have to do with graphing? How is this a
line?
The first question is the first one we should address. Since this has an
equals sign (=), this is an equation. We want values of x and y so that this
equation is true. What do we mean by that? We mean that when we plug
some x and y into the equation, we get something like 5=5. If, however, we
get something like 4=5, the x and y we plugged in do not satisfy the equation.
Therefore, if you happen to pick an x and a y value, (x, y), and it gives you
a true statement, you have found a point in the cartesian plane that satisfies
the equation. We can then plot this point in the cartesian plane.
Our ultimate goal is to find every point (x, y) that satisfies this equation.
But, we will take a step back now and devise a strategy for finding points
that make this equation true because it is not easy to just pick a point that
will work.
Since we have y = 2x+3, and we want an x and a y so that this equation
is true, we can pick any x and plug it in to the equation. Let's start simple,
with x = 0. If we plug this into the equation, we get y = 2 ·0+3 = 0+3 = 3,
so y = 3. Then, (0, 3) is a point that satisfies this equation. We can clearly
see that if we plug in 0 wherever we see x and plug in 3 wherever we see y,
then we end up with 3 = 3, which is a true expression.
Therefore, we can pick any x value we want, and plug it into the equation
to solve for y. Then, the resulting y value with the x we plugged in gives us
a point (x, y) that satisfies the equation. Let's try this for x = 1 in the same
equation y = 2x+3. Plugging in 1 for x gives us y = 2 ·1+3 = 2+3 = 5. So,
y = 5 when x = 1. Therefore, the point (1, 5) is a solution to this equation.
We can now plot these two points in the cartesian plane. This has been
done in Figure 5. Notice that the line connecting the two points has been
drawn also. This is because EVERY POINT on the line connecting these
two points also satisfies the equation!
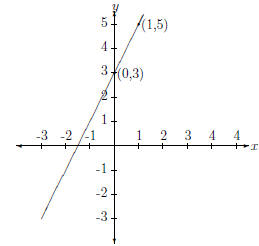
Figure 5: y = 2x + 3
Therefore, the equation y = m x+ b is the equation of a line in the cartesian
plane. We have discussed how to draw a line in the cartesian plane if we are
given the equation. We first pick a value for x, plug it into the equation, and
then solve for y. This gives us one point (x, y) in the cartesian plane that
satisfies the equation of the line. We then pick another value of x, and solve
for a new value of y and get a second point satisfying the equation. Then,
we draw the line connecting the points to get the graph of the line in the
cartesian plane.
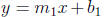
All About y = mx + b
The equation y = mx+b is called the slope-intercept equation of a line. Why
is this the slope-intercept equation? Are there other equations for a line?
These are two questions that we will answer in this section. But first, we
need some definitions so we are all on the same page.
I called this the slope-intercept equation of a line, but never defined slope,
or intercept. That isn't very fair. Let's start with the intercept. The
intercept
is the point(s) where the graph crosses one of the axes. There are two types
of intercepts possible in the cartesian plane, so to avoid ambiguity we call the
point(s) where the graph crosses the y-axis the y-intercept and the point(s)
where the graph crosses the x-axis the x-intercept. The intercept referred to
in the slope-intercept equation is the y-intercept.
Note that it is easy to calculate the y-intercept of a line that is not in the
form y = m x + b just by setting x to zero and plugging it into the equation.
This gives us the value of y when x = 0. But, the y-axis is at x = 0, so this
value of y is the y-intercept. The same goes for finding the x-intercept. We
plug y = 0 into the equation and solve for x. This gives us the value(s) of x
where the graph crosses the x-axis because y = 0 everywhere on the x-axis.
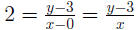
Now, what about the slope? The slope tells you how steep the line is, and
what direction it is going. Strictly speaking, there is an equation to calculate
the slope if you have two points of the line,  and
and  This is:
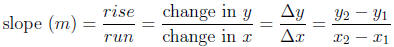
We have given 4 ways of writing the slope, starting with
the intuitive
definition and getting more technical at each step. All are equally correct.
However, using "rise / run" can lead to sign mistakes, so the others are
preferred.
Now, let's look at our initial equation of a line y = 2x + 3. We can
calculate the slope because we know two of the points on the line, (0, 3) and
(1, 5). So, let's calculate the slope:
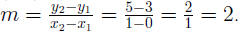
Therefore, the slope, m, of y = 2x + 3 is 2. We can figure this out by
"walking" along the imaginary grid created by the cartesian plane. And,
according to our definition of slope as "rise/run," we go in the y-direction
for "rise" units and then in the x-direction for \run" units. These steps are
illustrated in Figure 6.
This graph (Fig. 6) illustrates an important point. We can walk along
the graph by stepping  and get the same
thing. This is because
and get the same
thing. This is because  ,
,
and all we did was multiply the numerator and denominator by -1.
Figure 6: Slope as 
Now, looking at the graph in Fig. 5 or Fig. 6 we see that the line crosses
the y-axis at y = 3, so our y-intercept, b, is 3. If we plug in m = 2 and b = 3
into y = m x + b, we see that we get y = 2x + 3, the equation we started
with! This is why we call this the slope-intercept equation of a line! If we
are given an equation (or can beat an equation into the form of) y = m x+ b,
where m and b are numbers, we know everything about the line!
"Not so fast!," you say. "We only have one point (the y-intercept) and
the slope! This is not enough information to determine the line!" According
to our discussion this far, that is correct. However, consider the equation of
the slope one more time. But, this time, we know the slope, and we can leave
 and
and  as x
and y which we want to find. Let's use our slope of 2 that
as x
and y which we want to find. Let's use our slope of 2 that
we had before and the point (0, 3) and see if we can re-create the equation
of the line we had:
 , so
, so
 , multiply both sides by x to get
2x = y - 3, and add 3 to both sides to get 2x + 3 = y, or y = 2x + 3. So,
starting with a point and a slope, we got back to the slope-intercept equation
of the line! This means that if we have a slope and a point, we have all of
the information we need to graph the line!
In general, the point-slope equation of a line is
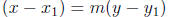
where we have the slope m and the point
![]() .
.
Finally, there is a general form of a line which does not tell us any
characteristics
of the line, but can be manipulated to give us the equation of the
line. The general form of a line is ax + by = c. To prove that this really
is a line, consider 4x- 2y = -6. This is not in the point-slope form or the
slope-intercept form. But, we can try to make it into one of these forms.
First, add 2y to both sides. Then we get 4x = 2y - 6. Then, add 6 to both
sides to get 4x + 6 = 2y. Now, divide both sides by 2 to get 2x + 3 = y,
or, y = 2x + 3, the same line we have been working with this whole time!
However, in the general form, this equation didn't tell us anything. But,
after solving for y (i.e. getting y to one side of the equation by itself), we
get
this into the slope-intercept form without much work.
Slopes
There are several special ideas that I will mention here but not devote much
explaination to. They all have to do with slopes.
The equation y = a where a is some number is a horizontal line that
intersects the y-axis at a. This is because there is no x in the equation.
Therefore, this is independent of the x you choose. So, for every x, the point
(x, a) makes this equation true because there is no x in the equation.
The equation x = a is a vertical line, for the same reasons y = a is a
horizontal line.
By definition, a vertical line and a horizontal line are perpendicular. This
means that the angle between the two lines in the graph is 90 degrees. This
idea of perpendicular lines can be extended to any two lines. If
and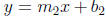 are the equations of two lines, then they
are perpindicular
are the equations of two lines, then they
are perpindicular
if  This means that if we have any line
y = m x + b, any line
This means that if we have any line
y = m x + b, any line
perpendicular to it has an equation like  because
Finally, parallel lines are just two lines that have the same slope. If two
lines have both the same slope and y-intercept, then they are the same line.
However, if they have the same slope and a different intercept, then they will
never touch each other.
Line Segments
Line segments are just what they sound like: they are sections of a line.
Typically, we define a line segment by giving its endpoints. For example,
the line segment connecting (0, 3) and (-2, -1) is just the part of a line
connecting these two points. This is shown in Fig. 7.
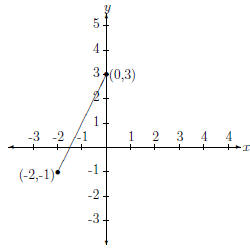
Figure 7: Line Segment
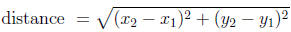
Is there a way to figure out the distance between these two points? Sure,
you could buy a ruler and measure them, but then you are just getting an
estimate. We want the exact length. Is that too much to ask? It turns out
that it really isn't. Remember the Phythagoran Theorem that has to do with
right triangles? Well, we can construct a right triangle around this segment
to find its length. We can draw horizontal and vertical lines from the points
to get a triangle with sides we can measure. In fact, sometimes we can even
let the axes do the measuring for us!
In Figure 8, we have drawn the only line necessary to make a triangle.
Now, let's look at the vertical side of the triangle. This has length

 Looking at the vertical side, we see that the length is
 Therefore, we can calculate the hypotenuse length by
the equation a2 +b2 = c2, and plugging in the
numbers for the sides gives us
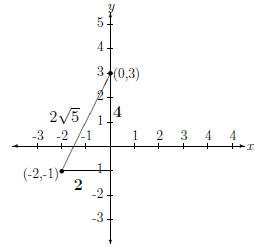
 So,
So,  Therefore, the length of
our line segment is
This may seem like a trick, but it always works. The vertical side of the
triangle will always have length  and the
horizontal side will always
and the
horizontal side will always
have length So, we can plug these into the
pythagorean equation
So, we can plug these into the
pythagorean equation
for right triangles to get:
The keen reader would have noticed that we left out the
absolute value!
However, this is not a mistake since  So,
when we square the
So,
when we square the
terms, they become positive, making the absolute value excessive.
The final question we may ask is: "what is the midpoint of this segment?"
Well, if the numbers are nice and clean, we can usually tell by looking at the
graph. However, people do not always draw perfect graphs. Therefore, it is
necessary to find an equation to calculate it exactly.
So, we have two points. We want to know the midpoint of the segment
connecting them. If we can calculate where "half way" between the x values
is and where "half way" between the y values is, then we have found "half
way" along the segment. This is just taking the average (mean), of the x
values to get the new x value, and the same for y. So, if you have two points,
![]() and
and
 , the midpoint of the segment connecting the
two is given
, the midpoint of the segment connecting the
two is given
by:
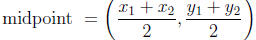
This is nothing but the average value of x and the average
value of y on
the segment. For the segment we have been considering, we have endpoints
(0, 3) and (-2, -1). Putting these into the equation gives us a midpoint of
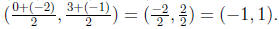 This has been plotted in Figure 9
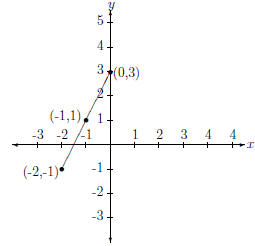
Figure 9: Midpoint